Technical Portfolio
Welcome, and thank you for stopping by! I'm glad you're here.
I specialise in engineering high-integrity data pipelines that make automated workflows more reliable, auditable, and production-ready. My work sits at the intersection of data automation and technical communication. I don't just build systems; I document them clearly so that anyone on your team can understand, maintain, and extend them.
Every project in this portfolio is open source, built from real-world use cases, and designed with a firm focus on Accuracy, Clarity, and Traceability. Whether it's validating incoming data before it ever touches a database, or structuring workflows that fail gracefully and log every error, the goal is always the same: systems you can trust.
If you find any of these projects useful, whether for your own workflows, a team implementation, or simply as a learning reference, I'd love to hear from you. Feel free to reach out via email or connect with me on LinkedIn. I'm always open to collaboration, feedback, or just a good conversation about data.
Featured Projects
1. Automated Data Validation Pipeline
Stack: n8n · Python · JSON Schema
A production-ready implementation of data integrity layers for automated workflows. It intercepts incoming JSON payloads via Webhooks and validates them against a strict JSON Schema before routing to the appropriate downstream path.
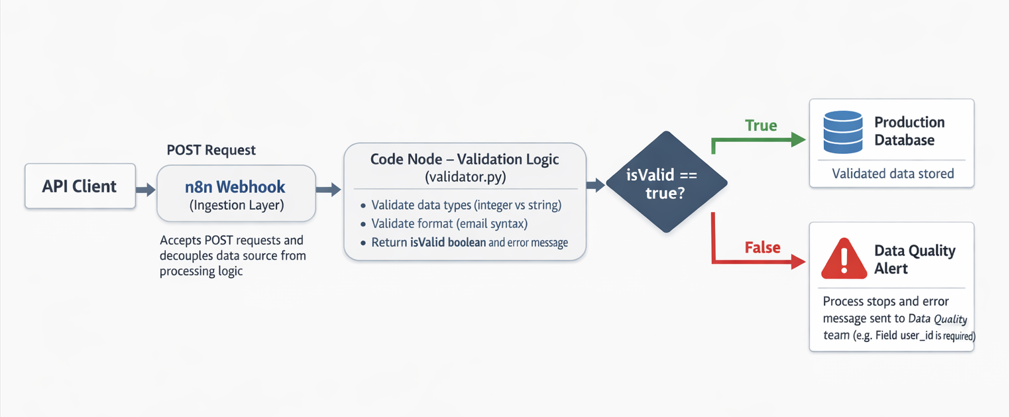
Figure 1: High-level system architecture, from ingestion to final routing.
Business Impact
- Reliability: Reduces database corruption by ensuring 100% schema compliance.
- Efficiency: Eliminates manual data cleaning, allowing teams to focus on core tasks.
- Traceability: Establishes a transparent audit trail for every rejected payload.
2. The Resilience Map: Kenya Poverty Vulnerability Analysis
Stack: Python · Pandas · Matplotlib · Google Colab · HXL Standard
A structured socio-economic analysis prepared for the ASAL Region Agricultural Initiative, guiding the 2025/2026 strategic budget allocation for Arid and Semi-Arid Lands in Kenya. The analysis ingests humanitarian data following the HXL standard, applies automated validation logic, and maps vulnerability trends against a 45% NGO intervention threshold to identify high-risk regions requiring agricultural subsidies.
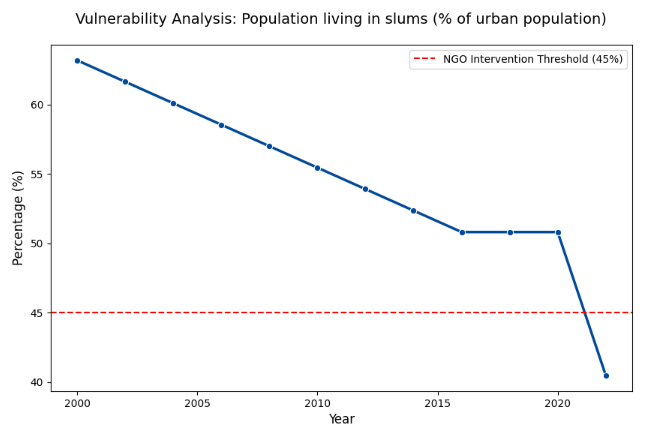
Figure 1: Vulnerability trend from 2000 to 2022 against the 45% NGO intervention threshold.
Key Findings
- Threshold Violations: Several years exceeded the 45% critical intervention threshold, indicating periods where local resources were insufficient.
- Trend Analysis: A visible downward trend from peaks above 60% in 2000, with 2022 still showing approximately 40.5% of the population in high-risk conditions.
- Risk Mapping: Automated flagging isolated specific temporal data points requiring immediate agricultural subsidies or social protection measures.
3. The Urban Pulse: Nairobi Network Stress Analysis
Stack: Python · Pandas · Matplotlib · Seaborn · Google Colab
A telecommunications data engineering project for a Kenyan network provider. The company collected network latency and user density data from cell towers across Nairobi, but the system exported data in nested JSON format that regional managers could not open in Excel or use for standard reporting. A Python transformation layer was built to parse the nested JSON, derive a custom Network Stress Score combining user load and latency, and export a clean, sorted CSV ranked by risk level for immediate use by management.
The cell tower dataset was sourced from the Humanitarian Data Exchange at data.humdata.org, containing over 78,000 real tower records across Kenya, filtered to 31,515 Nairobi towers for this analysis.